Term Path Alias
/sub-categories/maps
/sub-categories/maps
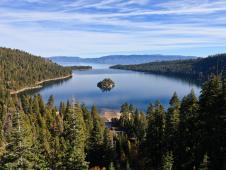 Lake Tahoe, seen here from Emerald Bay, was one of the primary validation sites for the global lake study. Image credit: NASA/JPL-Caltech
Article and Image Courtesy: United Nations Environment Programme (UNEP)

This Atlas is a visual account of Africa's endowment and use of water resources, revealed through 224 maps and 104 satellite images as well as some 500 graphics and hundreds of compelling photos. However the Atlas is more than a collection of static maps and images accompanied by informative facts and figures: its visual elements vividly illustrate a succinct narrative describing and analyzing Africa's water issues and exemplifying them through the judicious use of case studies. It gathers information about water in Africa and its role in the economy and development, health, food security, transboundary cooperation, capacity building and environmental change into one comprehensive and accessible volume.
In recent years, scientists have detected very high levels of aerosol pollution in the air over India. Some of it is the result of industrial and agricultural activity, and some of it is nature at work.

Article Courtesy: Earth Observatory
Image Courtesy: NASA
 Cyclone Jal brought heavy rains to the Bay of Bengal and the southeastern coast of India in early November 2010. This color-coded map shows total rainfall over the region from November 1–7. The heaviest rainfall—more than 600 millimeters or nearly 24 inches—appears in dark blue. The lightest rainfall—less than 75 millimeters or 3 inches—appears in light green. Superimposed on the map is the storm track, with darker shades of orange corresponding with greater storm intensity.
A band of heavy rainfall ran parallel to the November 5–7 storm track. Especially heavy rain occurred south and west of where Jal made landfall on India’s southeastern coast. The Press Trust of India attributed 11 deaths in Andhra Pradesh state to heavy rains from Jal.
Two Weeks Customized training program on Quantum GIS and GRASS GIS for Census Department was conducted by United Nations Population Fund Office(UNFPA), Koreain Collaboration with Magendhiran Consultancy Services from 18th - 29th Oct 2010.
New satellite images from NASA show the extraordinary scope of the continuing disaster in Pakistan, where thousands of square miles of land remain submerged two months after the country was hit by catastrophic flooding.
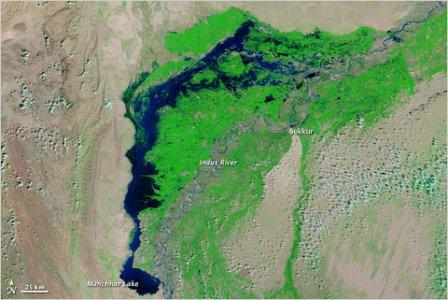 A satellite image captured last week shows flood waters lingering in Sindh Province and Manchhar Lake at twice its normal size.

The legislation is likely to be in the form of an upgrade to the AP Water Land and Trees Act (WALTA).

Click here for the current Act
Attached are two working documents that are being used to frame the discussion for the new regulations.
PLEASE NOTE: These in no way represent final or official positions of the AP Government or other organisations and are not to be taken as such.
The report presents flood plain mapping of Phulbari area within the flood plains of Brahmaputra basin in the States of Assam and Meghalaya using satellite data. Flood is a natural calamity in which most parts of the north-eastern region are ravaged. Management of the problem in these disastrous flood affected areas often requires flood plain mapping for protection and resource development. This has mostly being done in real time on the basis of time consuming and often hazardous ground based surveys.
The report deals with Geographical Information Systems (GIS) based rainfall-runoff modeling using Topography Model (TOPMODEL) for the Hemavathy catchment of Cauvery basin in Western Ghats of Karnataka. The TOPMODEL is a variable contribution area model in which the predominant factors determining the formation of runoff are represented by the topography of the basin and a negative exponential law linking the transmissivity of the soil with the vertical distance from the ground level.