
Samanvay Foundation has developed a knowledgebase for leaders working in nonprofit organisations, on issues related to software technology and its use in community programs. It covers strategy, management, economics, and appropriateness of software technology. This article comes from our experience of working in many such community programs for dozens of organisations over years. In this article, some of the fundamental concepts are explained in a generic form. It is also an attempt to develop a common vocabulary that hopefully makes us more efficient in communicating with each other.
About community program organisation and its beneficiaries
Unit of intervention
This is the most fundamental unit towards which the activities of the social program are directed.
- Client
- Household
- Group (self-help group, village committee)
- Facility (hospital, school, water source, farming polyhouse etc)
- Location (village, block, cluster, etc)
When the unit of intervention is facility or location, the activities are aimed at improving them in a manner that its members ultimately benefit from it somehow.
Organisation levels in a community service intervention (or program)
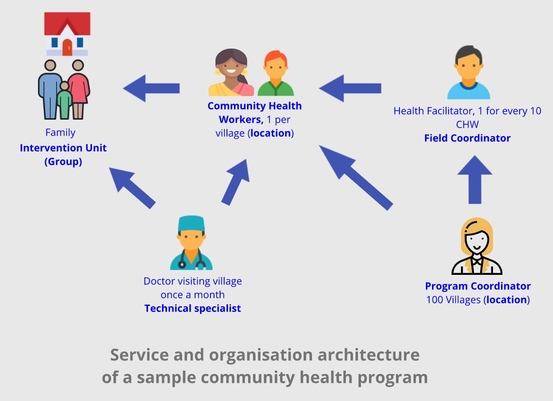
- Service or intervention target - Client, household, community, group
- Community/field workers
- Technical specialist
- Field-based coordinators/facilitators/supervisors
- Program coordinators/managers
- Funding organization(s)
Please note that 2-4 may not be the same as the legal organisation but that is not of much interest to us - in order to understand the logical structure of the community program organisations.
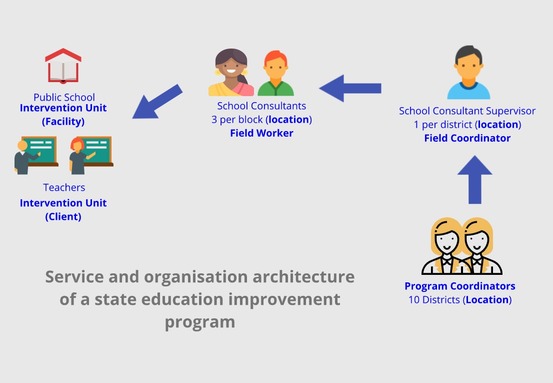
Let’s take two examples - one from health and another from an education program and apply the above. The concepts explained above have been highlighted in bold in the diagrams.
In our attempt to develop this knowledge base, we have generalised concepts for all sectors and all types of community programs. While this is consistent with 75-odd programs we have come across, we would welcome feedback if your program differs from the ones we have described here.
We would also like to state that we have excluded programs which perform periodic activities like health camps, disease screening, one time surveys, etc. Having said that, most of the concepts discussed here and later, we believe, may still be of interest to you.
Schema of data managed in community programs
Input/source data
Input data is the data which organisation members add to the system.
Longitudinal data
When one or more service providers, collect information about a unit of intervention, over a time period - the entire dataset about the unit of intervention is also called longitudinal data. This type of data is of most interest to us. There are two types of longitudinal data we may have.
- Observational data - This could be for establishing the intervention units’ status at a point in time, e.g. baseline, midline, end-line data.
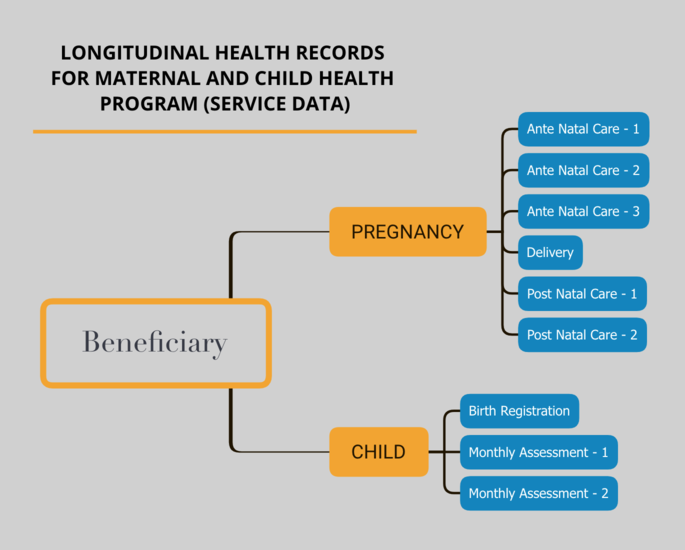
- Service data - Data on service provisioning like individual’s health record or farmer’s agricultural activities/intervention record. The diagram below illustrates two such data examples.

Cross-sectional data
It could be also referred to as survey data. It is the data collected about multiple entities (like intervention units) at the same point in time. Since they are collected at the same point in time, they are not multi-level and rich like longitudinal data. In the diagram above, for the water body, if the desilting program and water quality program are absent and the organisation is performing only annual surveys on water bodies, in the month of April, in a district - then that would be considered cross-sectional data.
Event data
These are like longitudinal data generated over time but without belonging-to or applicable-to an intervention unit. This could be the activity data logged by the community service provider like transportation record, supply received, expense reports, so on.
Sometimes event data can be about the intervention unit but there is no established trusted identity of the intervention unit. This is usually either because establishing the identity is difficult, cost-prohibitive, or not useful. e.g. this could be the list of people who fall sick with dengue in a given season, in a water and sanitation program which is more interested in the maintenance of water bodies (in epidemiology it is called line lists).
Finally, in case you are wondering, we have not covered the structure of supporting data like master data and metadata (e.g. question-answer data, answer options, etc). These are generally well understood since they have very broad application and not just community programs.
Input data in an organisational context
When the above data is overlapped with service providing organization then we can see the following classification of data.
- Beneficiary retained record (e.g. health card). This is a record which is maintained by the intervention units themselves and could be longitudinal in nature.
- Intervention unit service record, maintained by community worker for each intervention unit (e.g. individual-level health record, student’s record, household’s livelihood data, water source monitoring record).
- Service monitoring record could be same as intervention unit service record or could have fewer data elements based on relevance to the field coordination. This is for the purpose of project monitoring and execution planning.
- Service management record could be maintained by any/all levels of the servicing organization. These records are not specific to any beneficiary, although they could be linked to multiple beneficiaries sometimes. e.g. transportation details of a community worker, allocation of certain assets to multiple intervention units, training sessions attended, etc. This is of type event data.
Output data
Output data can be completely generated from the input data. It is of three types.
- Service indicators consisting of derived indicators from the underlying data (1-3 above). They are derived and maintained against aggregation dimensions e.g. the number of children vaccinated (indicator) in a month (time-period) in a village (location) from the CSR XYZ fund (funding source).
- Outcome/output targets created for assessing the intervention/project. These are for measuring achievement and not for service delivery. e.g. target for number villages reached, self-help groups formed, total-patients-cured.
- Insight data is gets created by running a domain-specific computation on the input data to derive some actionable insights. e.g. getting a list (or count) of children who are not gaining weight with age.
Measurement dimensions of output data
Social intervention programs capture the data to provide services and carry out their activities. Along with this, the input data is also important in understanding how their intervention is performing. This is usually done by tracking a set of indicators over certain dimensions. The indicators can be like, number of SHG’s formed, number of handpumps installed, so on. These are usually done along the following dimensions.
- Location hierarchy - e.g. village, block, district, etc.
- Period - e.g. week, month, quarter, season, so on.
- Organisational entities - funding organisation, NGO partner, projects
- Intervention unit's attribute classification - these dimensions are derived from the values of attributes of the intervention unit. e.g. age group, gender, caste, religion, water source type, school-level (primary, secondary etc).
These are also usually additively rolled up the hierarchy, period, and entity - but not necessarily. The number of handpumps installed in the block is a sum of handpumps installed in villages under it. Similarly, over period and entity. This, rolling up along the dimensions, is an important attribute of the output service indicators data.
Icon courtesy: icons8
This article has been republished with permission from Samanvay Foundation. View the original here.
/articles/architecture-community-program-organisations-and-their-data-systems