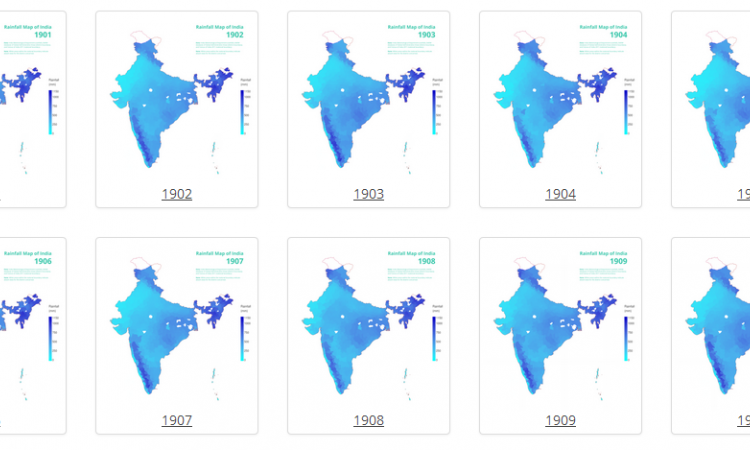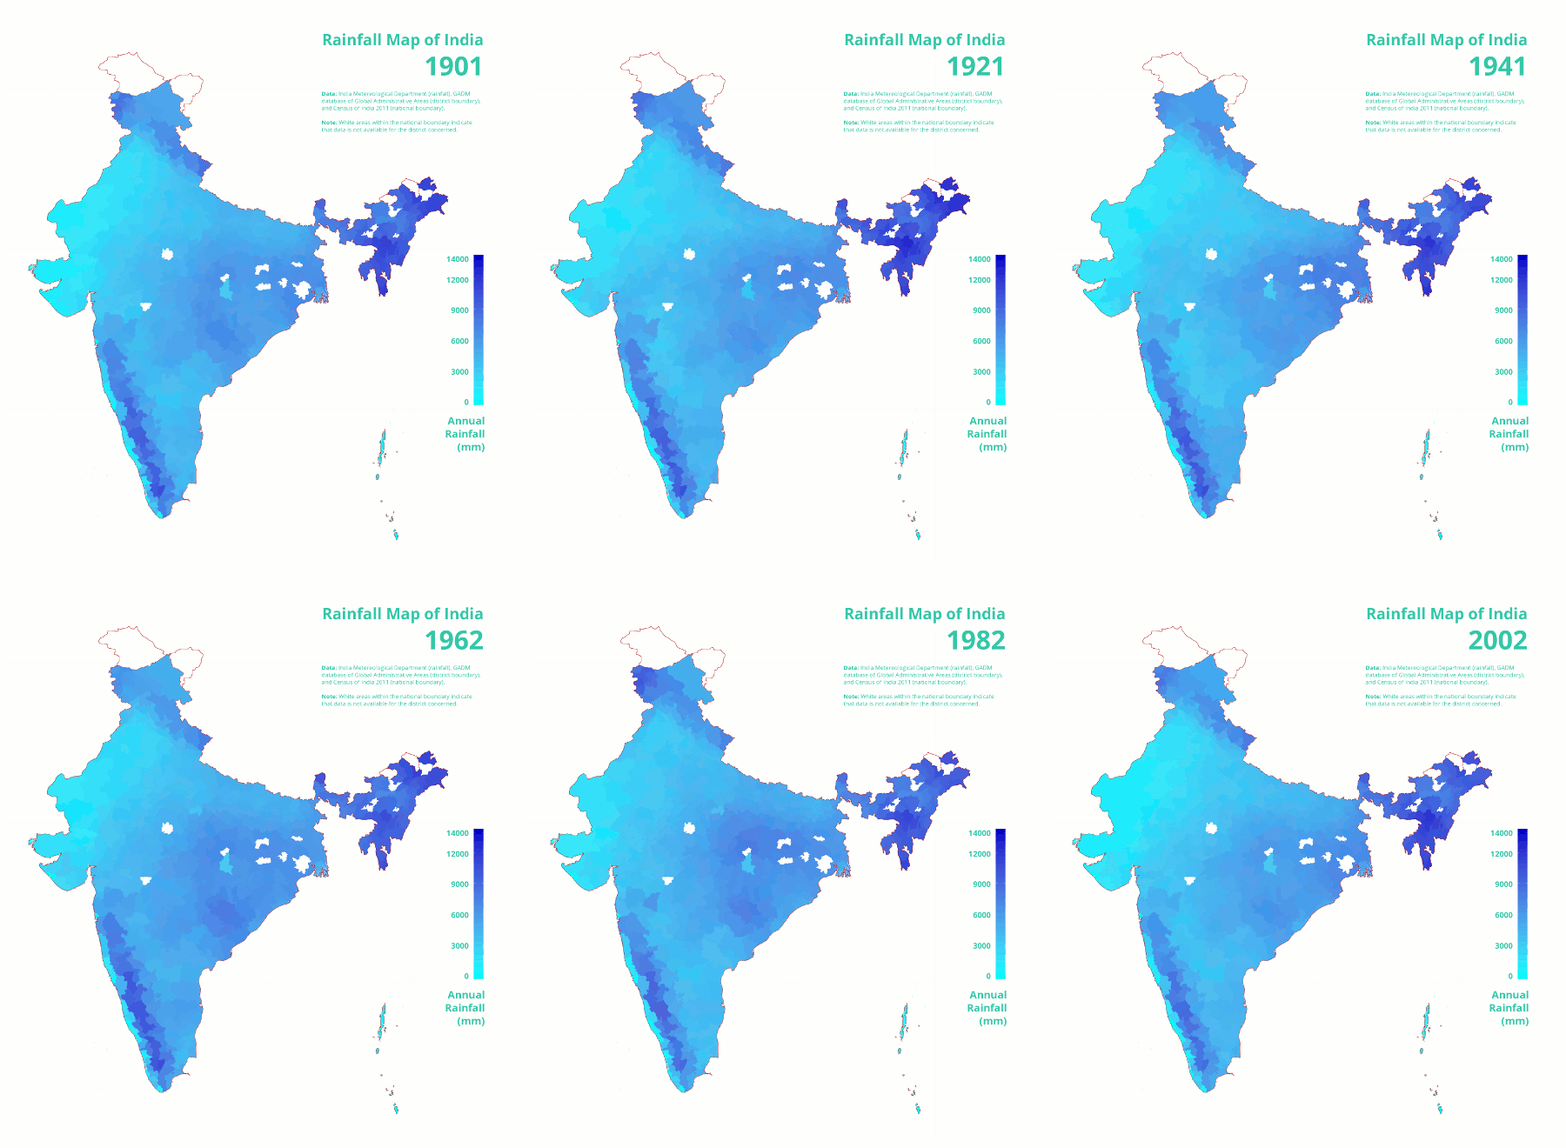
Rainfall maps of India (Source: IMD)
Rainfall maps for the period of 100 years were created to see the changing patterns and differences over time.
Data used
MET data was used to generate the maps for every year.
Rainfall maps description
- We created choropleth maps
- Each district has been shaded as per the volume of average monthly rainfall of that district for that year.
- A colour chart is given with each map where darker blue indicates greater rainfall and lighter cyan indicates lesser rainfall.
Emerging patterns
A few quick observations from the maps show certain patterns.
- Eastern states like Uttar Pradesh & Madhya Pradesh have maintained a balanced precipitation over the years ranging from 3000 to 6000 mm annually.
- The remainder have received rainfall less than 3000 mm annually
- Mean rainfall for locations have not significantly increased but certain locations have exhibited an increasing pattern in heavy rainfall ( greater than 70 mm) during the rainy season.
You can see the gif of the changing weather patterns here and click on it to take a closer look at the maps by year.
Path Alias
/articles/changing-pattern-rainfall-maps
Post By: NishaT
