Today, this amateur weather station has an unbroken and reliable record of temperature and rainfall data for the area. Considering the difficulties involved in a sustained effort of this nature, this is a remarkable achievement.
In the article that follows, Hopkins talks about the weather station and presents a summary of the data collected for the decades 1990-99 and 2000-09.

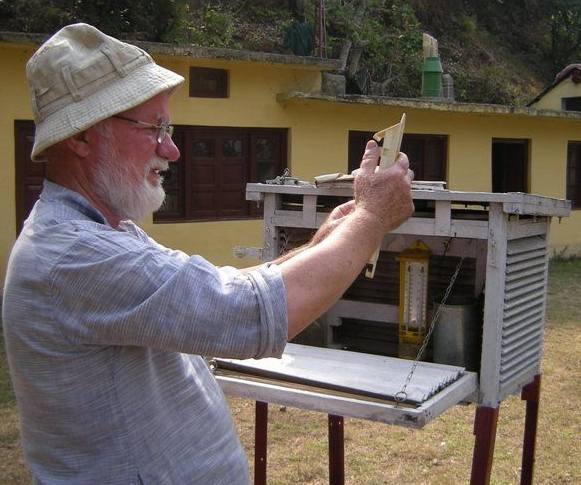
Illustration 1: David Hopkins at his weather monitoring station (Photo courtesy: Basant Pandey)
Early interest
I spent much of my childhood in the Kentish countryside in the extreme south-east of England. From an early age, I have had a fascination with the ever-changing patterns of weather, encouraged by an old barometer in the hall of our old farm house: the only barometer that I had ever seen that actually worked! I can recall maintaining a graph record of barometric readings, with descriptions of the daily weather, over a number of years.
My one and only purchase from an auction house was in my childhood, when I snapped up sixteen volumes of Symons British Rainfall from 1880-1895 for the princely sum of one shilling! These volumes reflected the passion that the British had even then for the weather, collating daily rainfall readings from hundreds of individuals across the length and breadth of the British Isles, and with in-depth analysis of extreme rainfall events.
Lakshmi Ashram
I first came to Lakshmi Ashram, Kausani in 1972-73. The Ashram is in the gram panchayat of Chhani-Lweshal, in Takula block of Almora district in the state of Uttarakhand. The campus of Lakshmi Ashram is situated on a south-facing slope sheltered from the winds blowing from the Himalayan ranges to the north, high above the valley of the Kosi river, which rises on the eastern slopes of Burha Pinath, a little to the west. The weather station is situated at a height of about 1,765 metres in a sheltered position at 29°.50.318 N, 79° 36.516 E (readings obtained from a GPS).
The weather station
When I first came to Lakshmi Ashram, there was a rain gauge, which allowed me to record the daily rainfall through almost twelve months.
However it was in 1986. that our present observations began, with assistance from the Uttarakhand Seva Nidhi. In that year we purchased a rain gauge and daily readings of rainfall began from November 1986, while in the following year we purchased a Stevenson screen, as well as a maximum and minimum thermometer and a wet and dry thermometer. Thus from November 1987 daily readings have also been made of temperature and relative humidity. Thus we now have some 25 years of rainfall readings, and 24 years of temperature readings.
At the end of 2009, we linked up with the Geography Department of the Almora campus of Kumaun University to participate in a Department of Science and Technology funded project that they are undertaking in the catchment of the Kosi river, and they have provided us with three additional pieces of equipment - a bucket rain gauge, an anemometer to record wind, and an evaporation pan.
The process of measurement
Readings are taken every morning at 0900 hours, of the maximum and minimum temperatures, relative humidity and rainfall. The maximum temperature is assigned to the date of the previous day, while the minimum temperature is entered to the date of the current day. Rainfall readings are assigned to the date of the previous day.
Since the collaboration began with the University of Kumaun, we are also taking anemometer readings and readings from the evaporation pan and bucket rain gauge. The daily maximum and minimum temperature and relative humidity readings are recorded on a monthly basis, and monthly averages then extrapolated. Likewise daily rainfall records are maintained on a monthly basis, and records maintained of total monthly rainfall.
Data sharing
Although weather recordings have been undertaken primarily for personal interest, from time to time we have been requested by Government departments, in particular the Forest department, for daily readings.
For a good number of years in the previous decade, Lakshmi Ashram contributed daily readings to MetLinkInternational, an educational programme for schools and individuals worldwide, organised by the Royal Meteorological Society through the internet. For the past two and a half years, we have been submitting daily readings every month to the Geography Department in Almora, and more recently I have begun to make monthly returns to COL (Climatological Observers Link) in the UK.
Indicators of possible climate change
There is a lot of public debate over the issues of climate change and global warming, and here too at the local level in Uttarakhand there has been a great deal of attention devoted to discussing these issues.
While it is hasty perhaps to arrive at any firm conclusions regarding changing weather patterns over a limited period of time, I have compiled a simple comparison of rainfall and temperature data from the two decades 1990-1999 and 2000-2009. While these time periods may be considered purely arbitrary, nevertheless the statistics do provide suggestions of possible long-term changes.
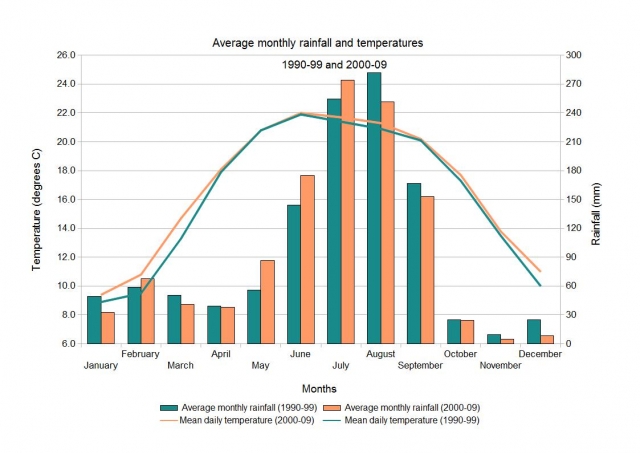
 Illustration 2: Average monthly rainfall and temperatures for 1990-99 and 2000-09
Rainfall
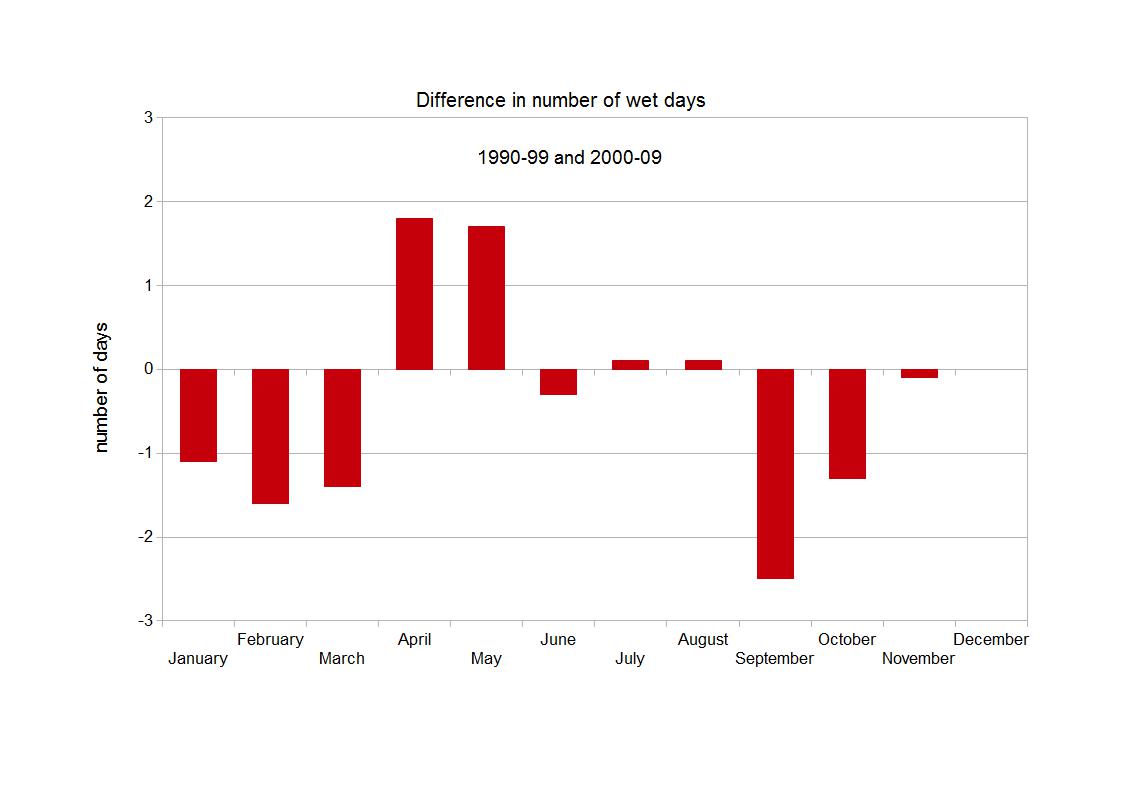
- Average monthly rainfall totals for the two decades, 1990-1000 and 2000-2009, have been calculated. While the annual average totals for the two decades, 1,159.4 mm and 1,157.0 mm, indicate no marked change, there are marked variations at the monthly level. There was also very little change in the number of rain days (>0.2mm) during the two decades, 119 days on average during 1990-1999, slightly declining to 116.6 days during 2000-2009.

Illustration 3: The difference in the number of wet days each month in the two decades
- The most noticeable change during the second decade was the marked decline in monthly rainfall totals from November-January, -46.8%, -67.1% and -33.7% respectively. Any decline in rainfall during these months is going to impact negatively on the rabi crops, in particular where agriculture is rainfed, as is the case, in most of the hill areas of the Kumaun. On the other hand May and June showed decadal increases of +55.9% and +21.7% respectively.
- Average daily maximum rainfall for each month during the two decades was also calculated. The figures indicated increases during February-July and declines from August-January. The highest increases were in May and June, reflecting the increases in average monthly rainfall, during those two months; likewise the highest decreases were in December and January.
- Highest decadal monthly rainfalls were also noted. While five months - February, March, May, June and July had their highest recorded daily rainfalls in the second decade, the other seven months all recorded higher decadal maxima in the first decade.
The data on maximum daily rainfall does not suggest an increase in more extreme rainfall occurrences. There were however two particularly extreme rainfall occurrences in Kausani during the second decade.
On 1 June 2004 heavy rain and hail for several hours caused destruction of fruit and vegetable crops, and saw flash floods in the valley below, with a landslide blocking the main road just below Kausani for some time. A total rainfall of 127.4 mm was recorded. However, a few kilometers to the south saw no rain at all.
Then on 7 May 2006 in the late afternoon there was heavy rain and destructive hail that brought a total of 91mm of rain, more than recorded in the previous six months. On this occasion too the rain was very localised.
Temperatures
- Monthly daily averages of maximum, minimum and mean temperatures have been calculated for the two decades 1990-1999 and 2000-2009.
- The mean temperatures indicate increases in mean monthly temperature ranging from 0°C in May and +0.1°C in June and September, to +1.4°C in March, +1.3°C in February and +1.2°C in April.
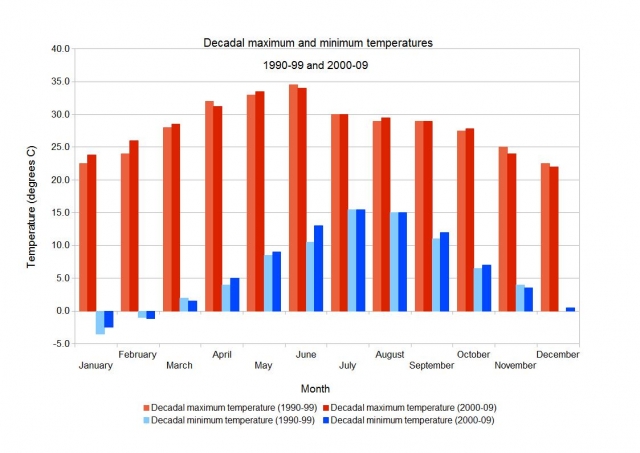
- Average monthly highest maximum temperatures have also been determined for the two decades. These indicate slight rises in six months, decreases in five months and no change in February. The highest increase is +0.7°C in March, while May and June see declines of -0.3°C and -0.5°C respectively.
- Average monthly lowest minimum temperatures have likewise been calculated. In most months these show an increase, only declining in September and November, while December showed no change.

Illustration 4: Decadal maximum and minimum temperatures for 1990-99 and 2000-09
- A comparison of the monthly decadal extreme maximum temperatures shows that the extreme monthly maxima in April, June, November and December were in the first decade, while the extreme monthly maxima in January-March, May, August and October were in the second decade, while July and September were equal. Only January and February showed differences of more than +1.0°C, reflecting maxima in January 2006 of 23.8°C and in February 2006 of 26.0°C. In that year very high temperatures were recorded across much of NW India in January and February.
- A comparison of the monthly decadal extreme minimum temperatures shows little marked difference, extreme minima occurring in the first decade in seven months, in the second decade in three months, while in July and August there is no difference in extreme decadal minima.
- By far the most extreme hot wave conditions experienced during the two decades were in 1995, when from 31 May to 11 June the maximum temperature was 32°C or higher for twelve consecutive days, reaching 34.5°C on 2 and 5 June, the highest temperatures that we have recorded in Kausani since we started taking readings. That summer was also extremely dry with only 23.8mm rain recorded between 30 March and 11 June. Not surprisingly that summer also saw extremely widespread forest fires throughout Uttarakhand.
- In general, the statistics suggest a rise in winter temperatures but no change in the peak summer months of May and June, which also experienced marked increase in average monthly rainfall. Extreme temperature maxima show very little decadal change.
Recording temperatures over more than two decades I have observed that during prolonged hot weather temperatures still rarely rise much above 30°C. Annual maximum temperatures ranged between 30°C and 34.5 in the first decade and 30°C to 34°C in the second decade.
Conclusion
The Kausani weather data provides important confirmation of the nature of changes occuring in the central Himalayan region. More importantly, David Hopkins' attention to weather provides anecdotal information about the very localised nature of weather in mountainous regions.
The latter is a very strong argument towards encouraging more enthusiasts to set up simple weather monitoring stations. This 'amateur' data could be crucial to making informed decisions regarding climate change adaptation.
/articles/amateur-weather-monitoring-kausani-almora-uttarakhand-summary-david-hopkins-observations