To reach a consensus on the well being of districts across the country, 2 indexes have been calculated using the per capita expenditure as a surrogate for incomes in this report that include:
Well Being Index (WBI): Measures the well being of an individual household
Categories on which WBI is calculated:
- Home amenities : Type of home (pucca / kaccha), primary source of energy for lighting, electricity units consumed, expense on domestic servant /cook and LPG, ownership of air cooler/ conditioner
- Kitchen facilities : Primary source of energy for cooking & ownership of appliances/white goods like stove, pressure cooker & refrigerator
- Education: Expense on education
- Entertainment : Expense on entertainment & ownership of radio, television, VCR/VCP/DVD player, tape recorder, CD player and personal computer
- Communication: Expense on landline telephone and mobile, ownership of telephone instrument and mobile handset
- Transportation : Expense on conveyance, ownership of personal transport vehicles like bicycle, motor cycle, scooter, motor car and jeep
- Healthcare : Institutional and Non-institutional medical expense
Salient features
- There is a wide disparity and diversity across districts within the same state
- Peninsular and the north Indian states rated as average or better and central and eastern states are average or worse off.
- Chennai, Mumbai, North Goa, Bangalore and Ernakulum districts take the top 5 positions.
- Goa, Delhi and Pondicherry are the 3 top tier states
- The eastern and north eastern states are in the bottom tier with Chattisgarh, Assam and Bihar trailing at the end
- A comparison between the WBI of 2010 & 2013 shows that the north eastern states of Nagaland, Mizoram & Assam and J&K show a huge decline, while most states from peninsular India, West Bengal and Orissa show improvement
Female Security Index (FSI) : Measures the well being, status & treatment of women

Categories on which FSI is calculated:
- Gender ratio in 0-6 years age group
- Incidences of Rape
- Dowry deaths
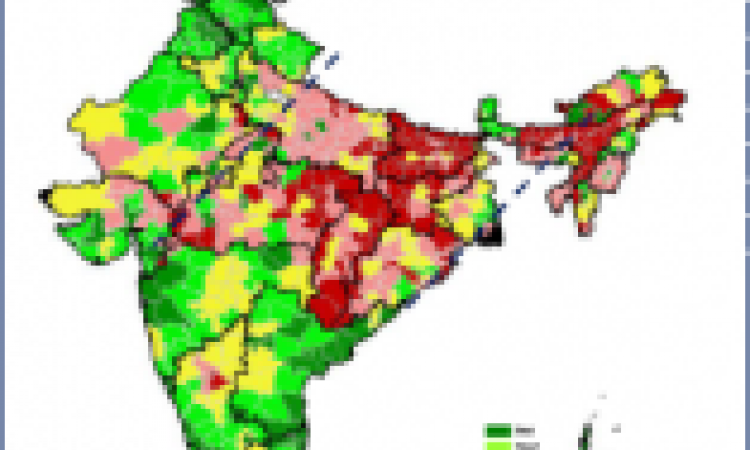
Salient features of the FSI
- The Nilgiris, Pondicherry, Kaikal, Sivaganga and Mahe districts take top 5 top positions
- Clear divide between North India & South India
- Uttaranchal and HP in North India are average or better
- Worst ratings for districts in Punjab, Haryana, Madhya Pradesh, West UP and North Rajasthan
- Pondicherry, Nagaland and Kerala are the safest states for women
- Punjab, Madhya Pradesh and Haryana are the worst in terms of women security
- Metros and mini- metros conspicuous by their absence in the top 20 safe districts
- Amongst the urban agglomerations, Chennai safest while Delhi NCR ranks at the bottom
- Delhi NCR earns the dubious distinction of highest rape cases and dowry deaths
- Comparison over 2010 shows that UP & Punjab show huge decline, while Rajasthan, Maharashtra & Jharkhand show slight deterioration

Features of WBI and FSI
- There is no apparent correlation between the Well Being Index and Female Security Index
- Southern states are the only ones faring well on both Wellbeing and Female security
- In-spite of a better WBI score, Delhi, Punjab & Haryana fare low on FSI
The following person can be contacted to obtain complete report:
Raman Kalyanakrishnan, Practice head, Tata Strategic Management Group
E-mail: raman.kalyanakrishnan@tsmg.com
Download the complete presentation here:
/articles/well-being-quotient-india-report-disparity-diversity-quality-life-across-various-districts