Term Path Alias
/sub-categories/news-and-articles
/sub-categories/news-and-articles
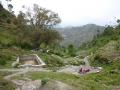
"We did everything ourselves", said the ebuillent Bhuvaneshwari Devi. "We took the cement up, carried the sand, everything! And we even told them where to place the tank"! She went on to narrate how the women's group of which she is a member, taught the men of the village that siting a tank in the stream will place it in danger of being washed away.
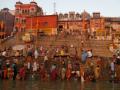
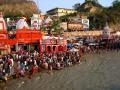
True to the promises made during election campaigning, Narendra Modi, India's 15th Prime Minister announced measures to clean up the Ganga as soon as he assumed office. A new Ministry in charge of river issues has been created.
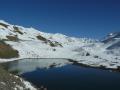
Scientists say Himachal prone to Uttarakhand-like flash floods
New Water Ministry headed by Uma Bharti prioritizes Ganga rejuvenation
“When the well is dry, we know the worth of water.” ― Benjamin Franklin
Fresh water found on land has only two primary sources - melting of ice, and rain. Harvesting rain is crucial for sustaining both the surface and sub-soil water sources.
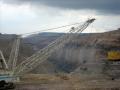
NGT tells Mahagenco to use clean coal
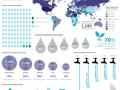
The rural-urban divide in access to sanitation reduces: UN
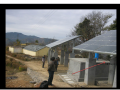
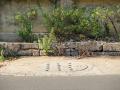
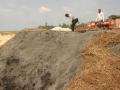
Churerdhar, a mountain village in Uttarakhand suffered from a lack of safe potable water. Here, hand pumps used to dry up in the summer and a natural spring 1.5 km away from the cluster of homes that housed 300 people, was the only other source of water. That was its plight in 2002.
Existing water sources