Nisha Thompson
Nisha Thompson
More data please...The changing landscape of open water data
Posted on 07 Apr, 2014 08:10 AMData related to the water sector although available online was very scattered and inaccessible and did not reveal much on its own when India Water Portal (IWP), Arghyam started the data project with the aim of providing better ways of accessing and representing data related to the water sector. The process led to some interesting learnings, revelations and very positive outcomes.

Urban water supply maps
Posted on 07 Apr, 2014 06:43 AMCleaning, analysis and contextualizing the available data
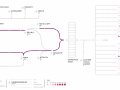
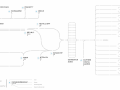
Mapping Bangalore's water supply
Posted on 07 Apr, 2014 06:14 AMThe construction of a visual map of water supply to Bangalore city from available data sets on water quality and water related infrastructure by NEERI as a part of the data project started by India Water Portal, Arghyam was a challenging task.
The visualisation process
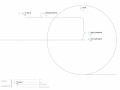
Mapping Mumbai's water supply
Posted on 07 Apr, 2014 06:09 AMThe construction of a visual map of water supply to Mumbai city from available data sets on water quality and water related infrastructure by NEERI as a part of the data project started by India Water Portal, Arghyam was a challenging task.
The visualisation process
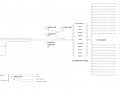
Chennai's water quality mapped
Posted on 06 Apr, 2014 11:39 AMObjective
To visualize the water quality of Chennai over its existing water supply infrastructure map.
Roadblocks
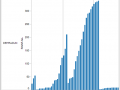
Playing with Uttarakhand rainfall data
Posted on 06 Apr, 2014 11:39 AMDaily rainfall information at a weather station level is very useful data. It can be used for analysis and planning. A district average can't help people plan or monitor a situation in a real time manner. It is possible to aggregate up for trends but deaggrating is impossible especially for places like Uttarakhand where the climate can change drastically from one area to the other.
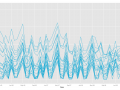
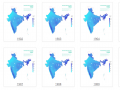
Changing pattern: Rainfall maps
Posted on 06 Apr, 2014 03:39 AMRainfall maps for the period of 100 years were created to see the changing patterns and differences over time.
Data used
MET data was used to generate the maps for every year.
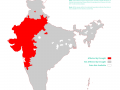
Mapping drought for 100 years
Posted on 06 Apr, 2014 02:15 AMThe Indian Meteorlogical Department (IMD) defines drought as ‘the consequence of a natural reduction in the amount of precipitation over an extended period of time, usually a season or more in length, often associated with other climatic factors (viz.
What do the numbers reveal about aquifers in India?
Posted on 05 Apr, 2014 10:54 PMGroundwater is water that is stored underground in aquifers or rock layers than can absorb water. India gets 85% of all its drinking water from this source.
Rainfall is an essential part of monitoring groundwater as it recharges the aquifer and brings groundwater levels up. Rainfall and well levels are important parameters for data collection.
The connection between well-level data and aquifers
Posted on 05 Apr, 2014 07:31 PMGroundwater is water that is stored below the ground in aquifers, or rock layers that can absorb water. India gets 85% of all its drinking water from this source.